Human Trafficking Outline

My submission will attempt to use data (criminal justice records, other administrative records) to identify various factors contributing to the rise of human trafficking.

Questions include:

What ethnicity has the highest rate of victims?

What parts of the country and portions of TX have the highest rates of victims?

Are children at a greater risk then adults?

What role do women play behind the scenes?

I am going to do a comparison of multiple factors using 8 data visualizations. This includes: Average Arrests By Gender, Comparison of Gender & Adults Vs. Minors, Regions of the country with the highest rates, Ethnicity with the highest rates, Number of Prevention agencies etc.

I will show growing trends, relationships, comparisons and other features so readers are able to determine what influences human trafficking… and why Texas’s numbers are significantly higher than other states.

Written By: Savannah Martens

Posted in Crime Prevention | Leave a comment

Identifying Factors of Human Trafficking in Texas & Across the United States

Human trafficking is defined as the recruitment, transportation, transfer, harboring or receipt of someone, with the use of force, coercion, abduction, fraud, deception etc. The current estimate of trafficking cases indicate over 1 million people internationally, with roughly 50,000 of those trafficked in the United States. The actual rate may be much higher since it is hard to document illegal activity. This blog will attempt to use data (criminal justice records, other administrative records etc.) to identify various factors contributing to the rise of human trafficking.

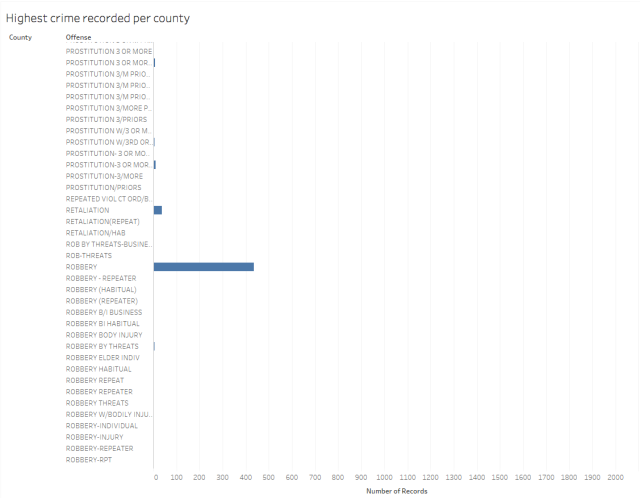
The types of exploitation include forced prostitution and other forms of sexual exploitation, forced slavery and similar practices, involuntary servitude and the removal of organs. So which is the most common?

1

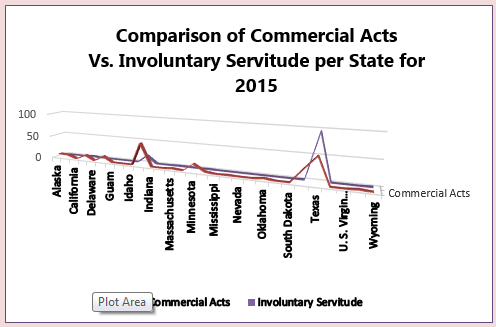
According to the above data, Involuntary Servitude which is defined as a person laboring against another person’s will to benefit another, under some form of coercion other than the worker’s financial needs is much more prevalent then commercial acts.  Commercial acts or prostitution is the business or practice of engaging in sexual activity in exchange for payment either as money, goods, services, or some other benefit agreed upon by the transacting parties.

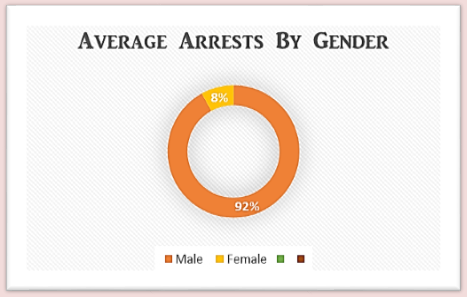
Women play an important role as perpetrators of human trafficking. Women tend to make up a larger share of persons convicted for human trafficking offences than for other forms of crime. In many countries including the US, women represent more than half of the population convicted for trafficking.

3

Trafficking can involve school-age youth, particularly those in challenging family situations. The children at risk are not just high school students—pimps or traffickers are known to prey on victims as young as 9. Traffickers may target minor victims through social media websites, chat-lines, after-school programs, shopping malls, clubs, or through friends and acquaintances who recruit students on school campuses.


4

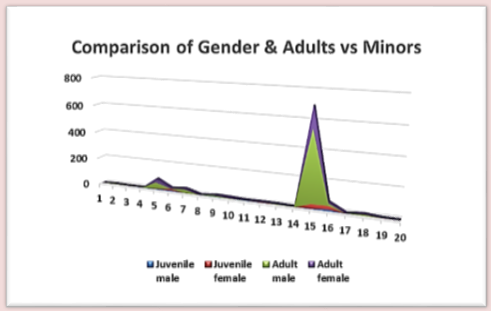
As you can see, the number of adults and females, greatly outweighs the number of minors and males. However, there is no single profile for trafficking victims; trafficking occurs in rural, suburban, or urban communities across the country. Victims of human trafficking have diverse economic backgrounds, varied levels of education, and may be documented or undocumented.

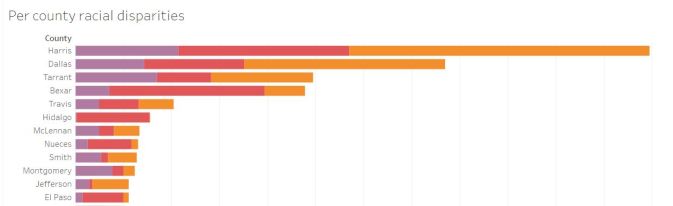
So which ethnicity currently has the highest percentage of victims?


2

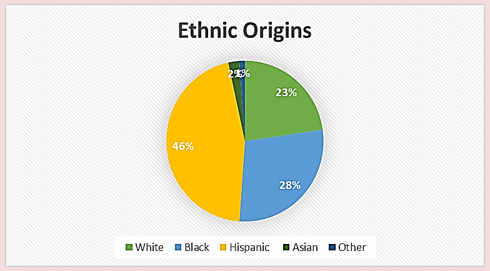
Hispanics lead at an alarming rate of 46% percent. This could be due to the non-portability of many work visas as well as the lack of familiarity with surroundings, laws and rights, language fluency, and cultural understanding.

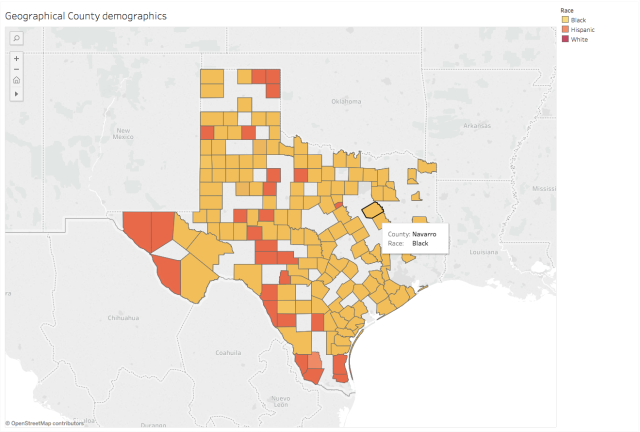
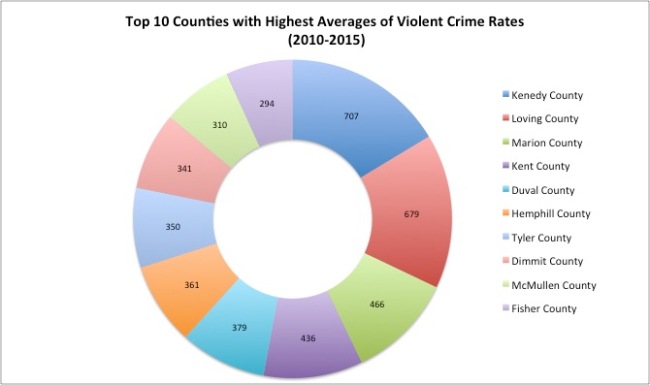
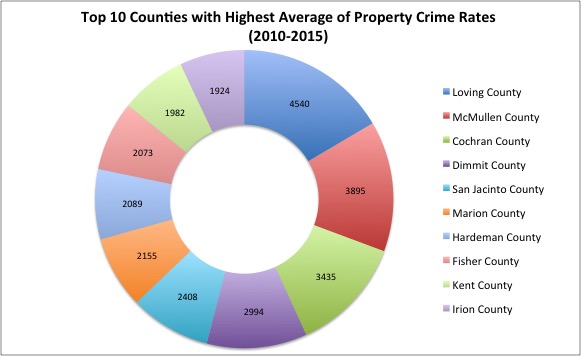
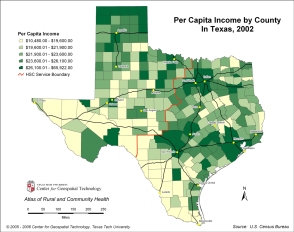
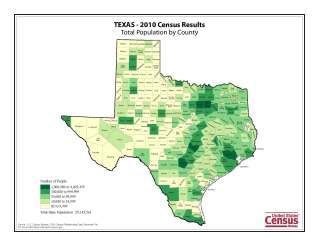
So which areas of the country is trafficking most common?


5

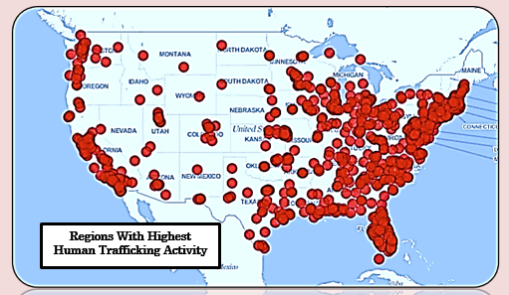
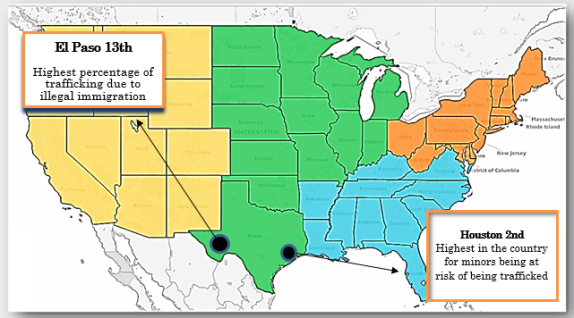
States that are coastal or do not provide enough assistance or compensation for victims tend to have the highest rates of trafficking.

The sectors most frequently documented are agriculture, construction, garments and textiles under sweatshop conditions, catering and restaurants, domestic work, entertainment and the sex industry. Human trafficking also affects mainstream economic sectors, including food processing, healthcare, and contract cleaning, mainly in private but also in public sector employment, such as the provision of healthcare services.


8

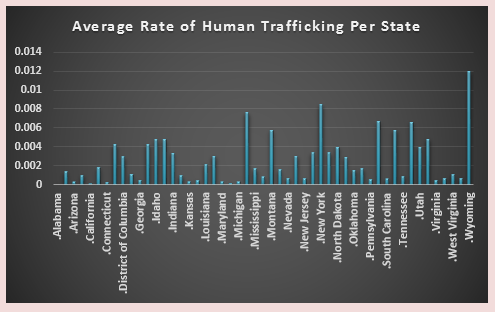
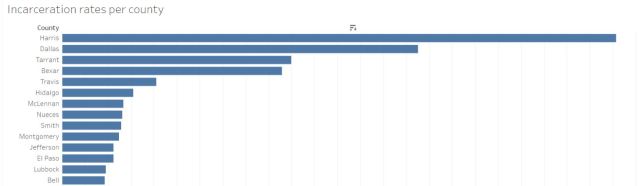
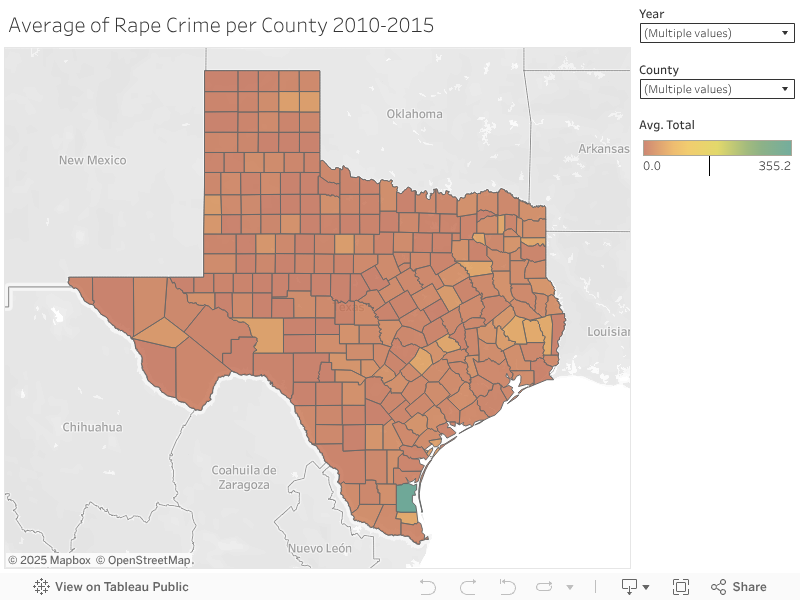
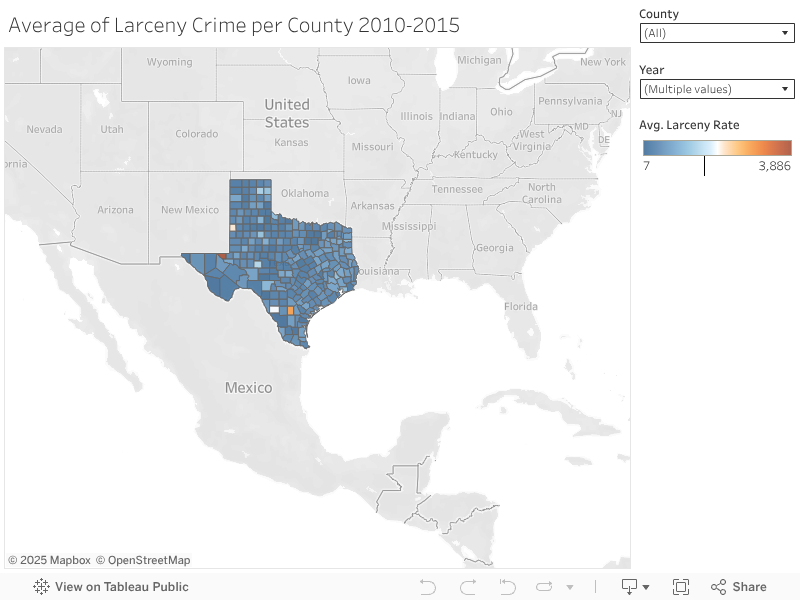
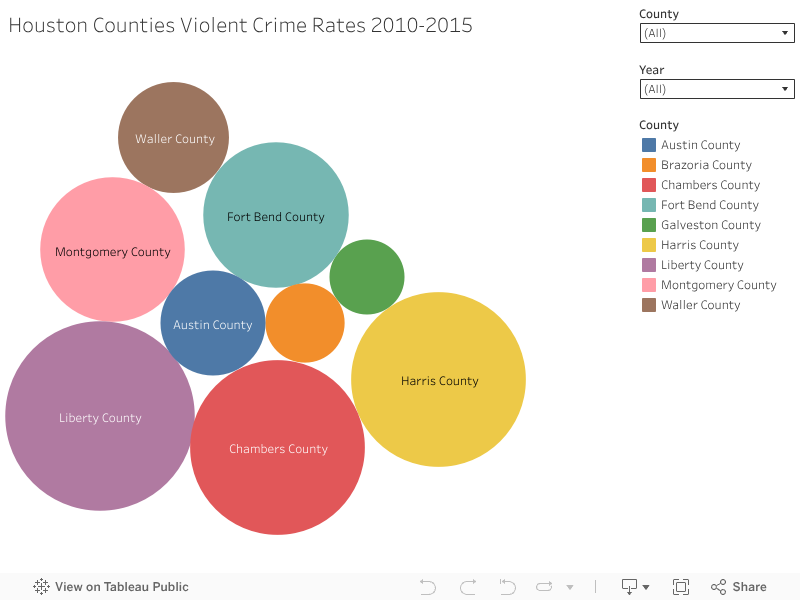
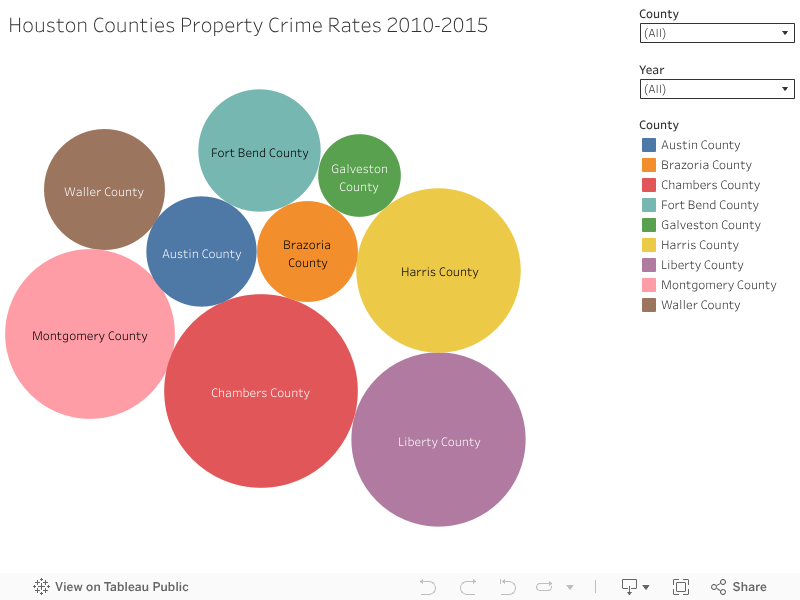
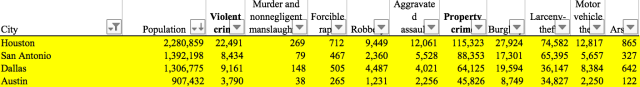
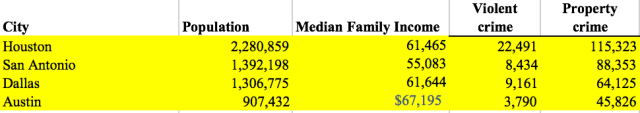
So how does Texas compare in this mix? Texas has one of the highest overall rate of victims and arrests. Illinois, New York, Florida and Louisiana complete the top 5. Texas cities Houston and El Paso make up two of the top 15 cities with the most trafficking.


6

What about prevention? What can we do to reduce these growing numbers?

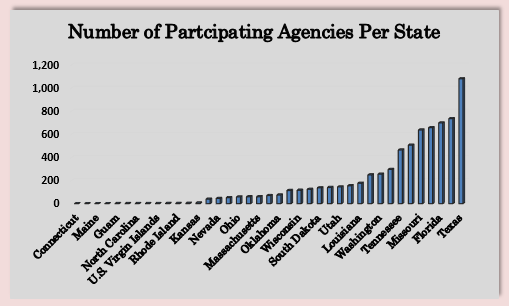
Nonprofit organizations such as Free The Captives partner with the community, law enforcement, and other government agencies in the fight against modern day slavery. Texas leads with the most volunteers nationwide combating this epidemic.


7

In conclusion, contrary to common belief, human trafficking is not just a problem in other countries. Cases of human trafficking have been reported in all 50 states, Washington D.C., and the U.S. territories. Victims of human trafficking can be children or adults, U.S. citizens or foreign nationals, male or female. Hopefully, creating awareness though education by taking into account some of these factors will be a useful tool in future crime prevention.

Published By: Savannah Martens

Posted in Crime Prevention, Human Trafficking | Leave a comment

Texas Redefines Mass Incarceration

Mass incarceration is a notorious issue that plagues the US government at a continuous rate. There is little to no resolve regarding the incarcerated population throughout the United States. Texas, specifically, has a diverse population and large demographic scale, resulting in a wide splay of incarcerated individuals among the African American, White, and Hispanic ethnic groups.

Incarceration Rates per County

County Population

Figure 1: Incarceration Rates per County – This shows the incarceration rates per county in the state of Texas.

rates per county

The image above displays the incarceration rates per population within Texan counties. This includes all recorded crime that has occurred within the various counties of Texas and it also compares those rates with the size of the county in relation to the other counties. This comparison emphasizes the correlation between population size/county size and the incarceration rates per county; the higher the population size, the greater the rate of crime happenings. Note that Harris county holds positions in both the largest county in Texas, and has the highest crime rate in Texas. Harris county’s demographics show that there is a steep incline towards the predominately black population creating stiff racial disparities within the county.

Per County Racial Disparities

Figure 2: Racial Disparities per County – This shows the breakdown of the three ethnic groups (Hispanic, Whites, Blacks) of incarcerated individuals per county. Please refer to the interactive link above to see details regarding each breakdown.

racial disparities

Incarceration Rates based on Gender

As shown above, there is a large population of incarcerated black males in Harris County, standing at 12,500 records per 100,000 persons for just black incarcerated individuals alone. Hispanics have a recorded number of 7,108 reported criminal individuals, and the white population stands at 4,302 recorded crimes in Harris County. There is a significant racial disparity occurring in this county, among others, further indicating that the demographics have a direct correlation to the rate of crime per county. It can be concluded that Harris county is the largest county in Texas, and the highest rated city regarding criminal activity with a large black and Hispanic population.

The demographics of Harris County play a large part in the incarceration rates and how crime affects the city. The influx of black incarcerated individuals translates to more violent crimes such as kidnapping, aggravated robbery with weapon, aggravated sexual assault (with child), etc. Among all the counties in Texas, there is a higher rate of violent crimes than non-violent crimes. This can be explained by the population demographics and the geographical location of the county.

Majority of the criminal population of Texas is made up of Hispanics, whites, and blacks, therefore the criminal activity is delineated according to leading ethnic group per county. Austin, Bastrop, and Brazoria county, all counties high in violent crimes such as murder, aggravated assault, and sexual assault, are densely populated by blacks. The act of violent crimes is directly correlated with largely black populated counties. Similarly, the counties densely populated with Hispanics such as, Kimble, Pesidio, and Maverick also show high rates for violent crimes such as murder and aggravated assault. However, there is also a high rate in marijuana possession and distribution. This is mostly due to the geographical positioning of the county in the Southern region of Texas. Being so close to the border of Mexico, these southern Texan counties have a strong relation with drug related crimes. These densely packed Hispanics counties have violent crime ratings as well as drug related crime. On the other hand, many white populated counties have non-violent crime ratings, such as burglary and DWI’s.

Crime Description per County

Highest Crime Recorded per County

Figure 3: Highest Crime Recorded per County – This visual provides all the various types of crime descriptions and reports the highest rated crime per county.

Screen Shot 2017-05-01 at 3.11.02 PM

Much of the incarcerated population in Texas is made up of blacks and Hispanics, and regionally speaking, the crime differs per northern and southern hemispheres within Texas. The northern counties experience more distributed crime within the range of non-violent to violent crimes. The northern counties have criminal activity that appears to be more localized, such as abandoned children, burglary, or even Marijuana charges, whereas the southern counties have more large scale crime such as murder, aggravated assault, and kidnapping. This kind of distinction between non-violent and violent crime creates a very thin line between northern and southern hemispheres, however, there is still a significant difference between varieties of criminal activity based on geographical location.

Geographical County Demographics

Figure 4: Geographical County Demographics – This shows the majority population of each county based on three major ethnic groups — Hispanic, White, and African American.

Screen Shot 2017-05-01 at 3.12.52 PM

There is a significant relation between racial disparities and geographical location that contributes to criminal activity in Texas counties. The crime rates continue to fluctuate based on population, demographics, and county location. The three ethnic groups that contribute to the crime rate the most are Hispanics, blacks, and whites. There are differences between each ethnic group in terms of criminal activity and geographical location of population. The increasing population of blacks is a major contributor to the incarceration rates of Texas, along with the Hispanic and white population, and the government needs to initiate proficient solutions in reducing criminal activity in Texan counties by attacking population distribution or perhaps demographic analysis and restructure. Crime and incarceration will continue to have a pervasive role in the state of Texas, and the government should be active in the solutions and remedies aimed at controlling the crime rates in an effort to deflate crime across the nation via non-violent methods and practices.


Written by: Somya Gupta


Posted in Crime Prevention | Leave a comment

Is Texas Crime Really That Bad

Written by: Courtney Shook

Have you ever wondered just how much crime there is throughout Texas? What about how big of a role Houston crime plays in Texas overall crime rate? Between the years of 2010 and 2015, Texas counties have had some dramatic changes involving their violent and non-violent crime rates. Some might say that they would not be caught in Houston after dark because it is such a dangerous place, when in fact Alaska and Tennessee have a higher percentage of crime rates than Texas. Do you wish you could see for yourself?

Do you wish someone would lay out Texas crime rates for you? Do you wish the data would be fun and interactive? Well, you can stop looking because your wishes just came true. The following information is going to give you a breakdown of Texas counties crime rates and just how big of a role Houston’s counties play in the Texas total. First, lets look at the big picture of crime in Texas per county, per year.

Over a five year span, the total number of violent crime rates have fluctuated throughout different Texas counties. The image is a visualization that shows the top ten Texas counties and their average violent crime rates during the time frame. Following this visualization will be a similar, yet slightly less violent visual of, you guessed it, non-violent property crimes. Between the two different data visuals it is clear that Kenedy County had the highest violent crime rate. Even Dimmit County came pretty close to passing up Kennedy County on total violent crimes, but it just was not enough.

top 10 c

Loving County took the lead with the highest property crime rate over the five years. Cochran had some of the highest property crime numbers during the five years but did not manage to beat Loving County when the numbers were totaled. With that being said, those two counties stay pretty high up, if not at the tip top, of each list. The year 2015 had the highest total non-violent property crime rates compared to the years prior. In fact, 2015 alone played a big part in the counties averages.

top 10 cp

To go more in depth, the next two visuals show the most often committed violent crime and property crimes. Based on the data, the most common violent offense in the state of Texas between the five years was rape. For this visual I combined two categories of data in to one to get the total instances. Rape data for “Forcible Rape” was collected under “Rape Legacy” until it was revised in the year 2013 to include more offenses as well as male victims within the Summary Reporting System.  For this visualization I have combined the “Rape Legacy” category as well as the “Rape Revised” category. The county with the highest rape occurrence rate is one that is already familiar to this story. Of course it is none other than Kennedy County with an average of 355 occurrences over the years.

Average of Rape Crime per County 2010-2015

Average of Rape Crime per County 2010-2015


As far as property crimes go, larceny was one that many Texas counties just couldn’t shake. Loving County took the win on this occurrence rate with an outstanding average total 3,886 during the five year period. Loving County stayed pretty consistent with their larceny crime rate over the years to the point no other county’s numbers were even close to catching them. The second highest county is McMullen with a total of 2,806 larceny occurrences, but even that high number is nowhere near Loving County. The two different crime category winners play a pretty big role in Texas’ total average rates. The two winners of these categories are the same two winners that took the lead with their high crime numbers in the visuals above. Feel free to take a dive into the two different crime categories and see for yourself.

Average of Larceny Crime per County 2010-2015

Average of Larceny Crime per County 2010-2015


To break the crime data down a little bit further, there are nine total counties that make up the Houston-The Woodlands-Sugarland metropolitan area. This is the fifth largest metropolitan area in the United States and the second largest in Texas alone. As of 2015 these nine counties account for 739,661 people within the total Texas population.

With that being said, this next image will allow an insight of the nine counties mentioned above and their average violent crime rates per year. The highest total violent crime average over the five year span is 227 violent offenses that fall under Liberty County. Galveston County stayed low on the list of nine with an average number of 35.6 during the timeframe. To go along with the violent crime image is another that represents the property crime offenses within the same nine counties. The averages vary from the lowest being Galveston County with 296 offenses and Chambers County with a total of 1,625 offenses. Over the years the number of crime rates have increased and decreased with each passing year. 2015 marked the highest year with an average total of 311.4 from the highest area. That area is up to you to find based on the data in the visual.

Houston Counties Violent Crime Rates 2010-2015

Houston Counties Violent Crime Rates 2010-2015


Houston Counties Property Crime Rates 2010-2015

Houston Counties Property Crime Rates 2010-2015

These nine counties makeup the city of Houston and their numbers are the ones that represent Houston’s crime rating. Houston is a major city in Texas with a total population of 2,239,558 people and continues to grow rapidly. Along with a growing population comes an increase in crime rates and total offenses that can damage a booming city.

In conclusion, crime effects every state, every city, and every county. High crime rates exist everywhere and can damage or even tear apart a society. Crime is inevitable and plays a major role in a state’s image, all the way down to the small counties that exist within that state. Crime numbers are always changing and always will as long as the population continues to grow and cities expand. Hopefully these visuals give you a representation of the prevalence of crime throughout Texas counties and the amount of weight it carries on Texas as a whole.


Posted in Crime Prevention | Leave a comment

Crime Rates in Texas’ Four Major Cities

Every year, thousands of crimes occur all over the US. Although Texas may not be the most dangerous state, it is home of some of the largest cities in America; Houston, San Antonio, Dallas, and Austin. These four cities are among the top 11 most populated cities with over 1 million inhabitants each, Austin in close last with over 900,000.

You can see the populations of these cities here.

With large populations comes large crime rates. It is inevitable in this day and age. And after doing some research based on population and crime rates, numbers were as expected except for one major city: Dallas. Dallas is the third of the four largest city in Texas, however some of the highest crime rates came from it.

Screen Shot 2017-04-30 at 9.36.33 AM

I was able to find the crime rates for these 4 cities in specific categories and subcategories.

Violent crimes included murder and non-negligent manslaughter, forcible rape, robbery and aggravated assault. Property crimes included burglary, larceny-theft, motor vehicle-theft and arson.

This data visualization I have published will give you a better understanding of the types of crimes and amount of crimes happening in each city.

With a population of over 2.28 million, Houston was predicted to have the amount of crimes it does. Based on the data I acquired, Houston’s crimes almost double in majority of the crimes, violent and non-property, which is expected from a city almost twice as populated than the rest.

Austin, with a population of just over 900,000, has the least crimes in all categories across the board, which is also expected. On the other hand, San Antonio and Dallas take the second and third spot respectively, however Dallas has significantly higher crime rates almost all across the board. This is where I figured income would make a difference. Could a higher income mean higher crime rates?

Based on my research, San Antonio has roughly 1,393,000 inhabitants, with a median income of $63,981 while Dallas has a little over 1,300,000 inhabitants, with a $72,350 median income. At first I believed a lower income would be a huge playing factor in the amount of crimes happening in these cities, but I may have been wrong.

The charts pictured above display the median income of households in San Antonio and Dallas. As you can see, with a median income of $61,644, Dallas has a higher income compared to San Antonio which has a median income of $55,083.

Furthermore, in the charts above, you can see that Austin and Houston have an income of $67,195 and $61,465 respectively.

Screen Shot 2017-04-30 at 11.53.05 AM

As you can see, the median family income does not correlate with the amount of crimes committed in these four cities.  If higher median income meant higher crime rates, Austin would be at the top of the crime list, however its crime rates are significantly lower than the rest of the cities.

Written by Brenda T

Posted in Crime Rates | Leave a comment

Crime Rates in Texas’ Four Major Cities

My data includes the crime rates compared to the income rates from the four major and most populated cities in Texas; Houston, San Antonio, Dallas and Austin. My first data visualization will be a chart displaying the population in the four cities which will give us an idea of the numbers we will be working with based on people.

I will then include a data visualization of the crime rates in these four major cities. These crimes include:

  • Property Damage crimes
    • Burglary, Larceny-theft, motor vehicle-theft and arson
  • Violent crimes
    • murder and non-negligent manslaughter, forcible rape, robbery and aggravated assault

This will help us understand the types of crimes happening in each city as well as the amount of crimes in each category.

I will also include four data visualizations based on the income rates of each city. My biggest question: do income rates affect the crimes happening in each city? These four charts will be able to give an idea of the income rates in the cities, and will hopefully be able to come up with a conclusion on if there is a correlation between crime rates and income rates from each city.

Posted in Crime Rates | Leave a comment

Crime Rates in Texas’ Four Major Cities

As mentioned in my last post, the four major cities with the highest population in Texas are Houston, San Antonio, Dallas and Austin. These four cities have significantly high crime rates, and due to some research, I was able to find the specific numbers for these crimes.

Screen Shot 2017-04-30 at 9.36.33 AM

As you can see, Houston, being the most populated of the four has the highest crime rates of the bunch. San Antonio and Dallas have very similar populations, but crime rates vary between them. Austin has the lowest population of them all, and also have the lowest crime rates all around.

I was also able to find income rates for these four cities.

The rates above are based on median household rates. Income in households ranges from ~$55,000-$68,000 in these four cities, Austin being the highest and San Antonio being the lowest.

Written by Brenda T

Posted in Crime Rates | Leave a comment

Crime in Texas’ Four Major Cities

Texas holds 4 of the top 11 populated cities in America, and with high populations comes high crime rates.

Houston, San Antonio, Dallas and Austin are the 4 largest cities in the state of Texas respectively, and all hold significantly high crime rates. Each city holds almost over 1 million inhabitants each, and Houston being the biggest is populated by over 2 million. I believe the reason for these high crime rates has to do with the income rates in each city.

In this blog, I will be comparing and contrasting crime rates to the income of household to see if there is any correlation between high or low income and higher or lower crime rates in each major city.

Per Capita Income by County in Texas

cb11cn37_tx_totalpop_2010map

You can see in the maps below how the income and population surrounding these four major cities is the highest in the state. The map on the right displays the per capita income by county, and you can see that where these cities are located seems to be the highest income. Same goes for the map on the right; that map displays the last census done in the United States in 2010. Although several years have passed, the information remains the same, just with slightly larger numbers.

The regions with the highest populations are also the regions with the highest incomes. I will be doing more research on crime rates in these cities to see if higher income and correlate with the rate of crimes.

Written by Brenda Tamez

Posted in Crime Rates | Leave a comment

Crime Rates in Texas Outline

My first data visualization will show information regarding all Texas counties in ascending order based on their crime rates over a span five years, 2010-2015. It will show each of the counties average crime rate associated with the specific year. The visualization will illuminate a consistent pattern in the prevalence of crime attributed to specific counties over the course of five years. I will be emphasizing counties, such as Kennedy County, which have consistently high crime rates compared to other counties. The questions that I will answer with the data provided in the visual are as follows:

  1. Over the span of five years which county has the highest crime rate?
  2. What specific year had the highest overall crime rate?
  3. Which counties, if any, had a significant fluctuation in crime rate from one year to another?

Furthermore, my data will show the average property crime rates per Texas county over the span of five years. For this data, the following are categories that fall under “Property Crimes,” burglary, larceny, motor vehicle theft, and arson. I will emphasize certain counties with the highest property crime rates, such as Loving County and how it compares to others that have low rates, like Dallas County. My data will show if there is a correlation between counties with high violent crime rates and counties with high property crime rates. I will be emphasizing the correlations, if any, of those certain counties. This data visualization will answer the following:

  1. Which county has the highest property crime rate over the five years?
  2. What specific year had the highest property crime rate?
  3. Is there a correlation between the counties with high violent crime rates and the counties with high property crime rates?

In addition, I will show two visualizations that represent the highest violent crime overall, which is rape, and the highest property crime overall, which is larceny. Rape data for “Forcible Rape” was collected under “Rape Legacy” until it was revised in the year 2013 to include more offenses as well as male victims within the Summary Reporting System.  For this visualization I have combined the “Rape Legacy” category as well as the “Rape Revised” category to get the total average of rape per county per year

These two visualizations will show which region in Texas has the highest of the two separate crimes. I will discuss how the two different crime rates play a roll in the total crime rate of the county as well as Texas itself. These two visualizations will answer the following:

  1. Which county has the highest rape rate?
  2. Which county has the highest larceny rate?
  3. How do the counties with the highest two crime rates tie into the total average of Texas’ crime rates?

In conclusion I will show the nine counties of the Houston-The Woodlands-Sugar Land metropolitan area and their population size. This visualization is to show how the nine counties make up for a fairly decent amount of the Texas population in total. I will be discussing how the counties population size may or may not play a part in the high/low amount of crime the county has. Following this visualization I will show the nine counties and their violent crime rates per year per county. After, I will give one last visualization that included the nine counties’ property crime rates per year per county. These two visualizations are to show how this specific metropolitan area’s crime rates have tied in to the total amount of crime in Texas. All three of the visuals will show how the role, that the crime in Houston has taken in Texas’ total amount of violent and property crimes over the years. Along with that I will be emphasizing the fluctuation, if any, of Houston crimes over the years. For example, there is some fluctuation with how Harris County jumped up in average violent crime rates from the year 2012-2013. These three visualizations will answer the following questions:

  1. How does Houston and its surrounding counties population affect the total Texas population?
  2. How big of a part does Houston and its surrounding counties have in the total violent crime rate and property crime rate in Texas?
  3. Have Houston’s crime rates increased or decreased more over the years? If so, how much did it effect Texas’ total crime rates?

This will be the set order of my seven data visualizations. I chose this order because it creates a nice flow starting from the big picture and the breakdowns that help make it whole. Starting with the main visualization of Texas counties and their crime rates over the years gives it a nice and broad start. As the visualizations are show in order they will continue to give different break downs of how just one county effects a state’s total crime rate. The visualizations in this order answer will be able to answer multiple different questions ranging from, the total crime rates throughout Texas, down to how a small county with a population of 29,563 can increase/decrease those rates.

Written By: Courtney Shook

Posted in Uncategorized | Leave a comment

Mass Incarceration in Texas Outline

My first two data visualizations will provide information regarding the counties of Texas and how they ascend in order of high to low based on incarceration rates within Texas counties. I will emphasize that Harris county is the highest rated county in Texas, and I will discuss the crime description within Harris County, including the racial disparities (of Whites, Hispanics, and Blacks) that contribute to these crime descriptions of Harris county. I will compare the size of Harris county to the size of the remaining counties of Texas to show the significance of Harris County being the highest rated county for incarceration. The questions that I will answer with this data set/visualization will be

  1. which county has the largest incarceration rate in Texas?
  2. what are the racial disparities that occur within this county?
  3. is this the largest county in Texas?

Furthermore, my data will analyze the racial disparities among Texas counties and will compare the average rate of incarceration per racial group. My data will show that African Americans make up majority of the incarceration rates within Texas counties, doubling the amount of incarceration rates for Whites. Hispanics are the number two ethnic group that contribute to the racial disparities that prevail the Texas counties, among Blacks, Whites, and Hispanics. I will also discuss the gender disparities that exists per county and how those differences compare to the overall problem of mass incarceration in Texas. This set of data will answer the following:

  1. what are the rates per ethnic group for incarcerated individuals?
  2. how do these groups compare?
  3. what is the largest incarcerated ethnic group in all of Texas?

Then I will showcase crime rates per county, comparing the northern counties to the southern counties. I will discuss the demographics, population size, and the crime description per county. My data will show that there are counties within Texas that are hosts to a large population of Blacks; these counties experience higher crime rates than other counties within the same hemisphere of Texas. Southern counties that experience higher crime rates have a larger African American/Hispanic demographic, versus the northern counties of Texas that have a predominately White demographic. The northern counties experience less crime rates due to the population size, demographic, and geographical location. The southern counties have larger population sizes, thus creating higher crime rates in the federal labeled crimes. This data set will further explain the racial disparities among incarcerated individuals and will also continue to present that African Americans are the leading racial group in mass incarceration within Texas. This will answer:

  1. how the racial disparities are affected per region throughout Texas?
  2. what is the significance of this regional split?
  3. geographically, how do demographics play into the problem of mass incarceration within Texas?

This is the order of my four sets of data visualizations; this will create a nice flow from small scale discussion to the whole picture of mass incarceration in Texas.


Written by: Somya Gupta

Posted in Crime Prevention | Leave a comment